Location
This item is located in the Impact Dashboards Report, in both the Extension and SNAP-Ed Highlights.
Modules Included
This report item includes data from:
- Indirect Activities
Filters
PEARS Applied Filters
The following filters are applied by PEARS behind the scenes:
- Test Data: Any data entered by a user marked as a Test User (usually PEARS team members) will not be included for normal users.
- Viewable by User: Only data that the logged in user (or creator of the dashboard share) can see will be displayed.
- Program Areas: For the SNAP-Ed Highlights dashboard, data is filtered to only include SNAP-Ed records initially.
User Available Filters
The following filter criteria can be applied by users:
- Reporting Periods
- Program Areas (Only for Organizations that use Program Area field)
- Users
- Units
- Sites
- Action Plans (only for Extension Highlights)
- Interventions (only for SNAP-Ed Highlights)
- Settings
- Complete
Calculations
The data points are calculated as follows for all data that fit the criteria above.
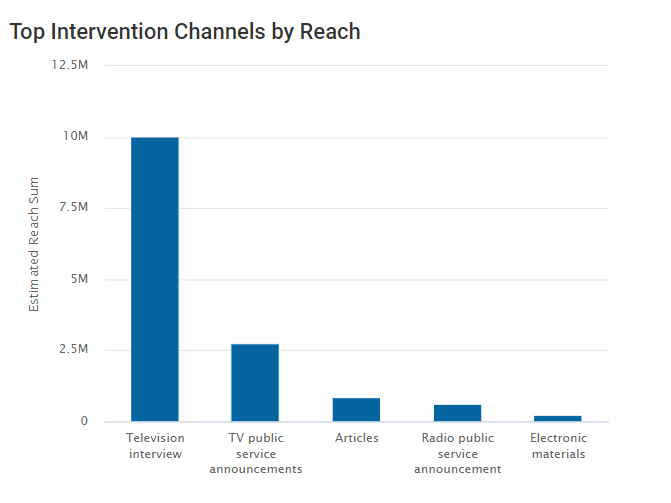
- Indirect Activity Intervention Channels within the Intervention Channels and Reach section are grouped together by the intervention channel and the Estimated # of Unique Individuals Reached of the channels are summed up.
- The five channels with the highest reach totals are displayed in a column chart.
- Reach totals of each channel are displayed when hovering the mouse over a specific column.