- From the PEARS homepage, hover the cursor over the Analyze menu and click Unit Snapshot.

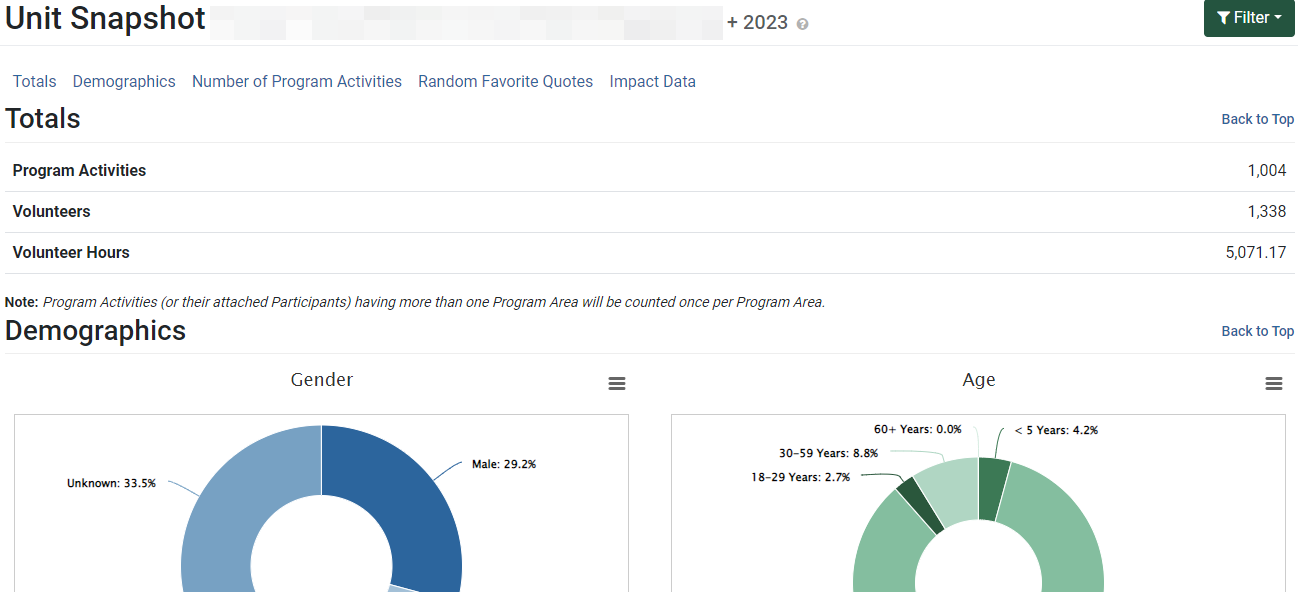
- The Unit Snapshot report displays:

- By default, the Unit Snapshot report is filtered to show data from completed records within the entire state created during the current reporting year. Click the Filter button to change the default filters.

- Filter options display. Change the filter criteria as needed to display the desired set of data.

- Click Apply to confirm the selected filters. Each section now shows data based on the applied filters.

- The applied filters are listed at the top of the Unit Snapshot report. For example, the Unit, Date range, and Year are displayed here:

The Unit Snapshot report includes five sections. Links at the top of the page allow easy navigation to specific sections. Alternatively, scroll down the page to see each section:

- Totals
The Totals chart lists the number of Program Activities, volunteers, and volunteer hours for activities that correspond to the selected filter criteria.
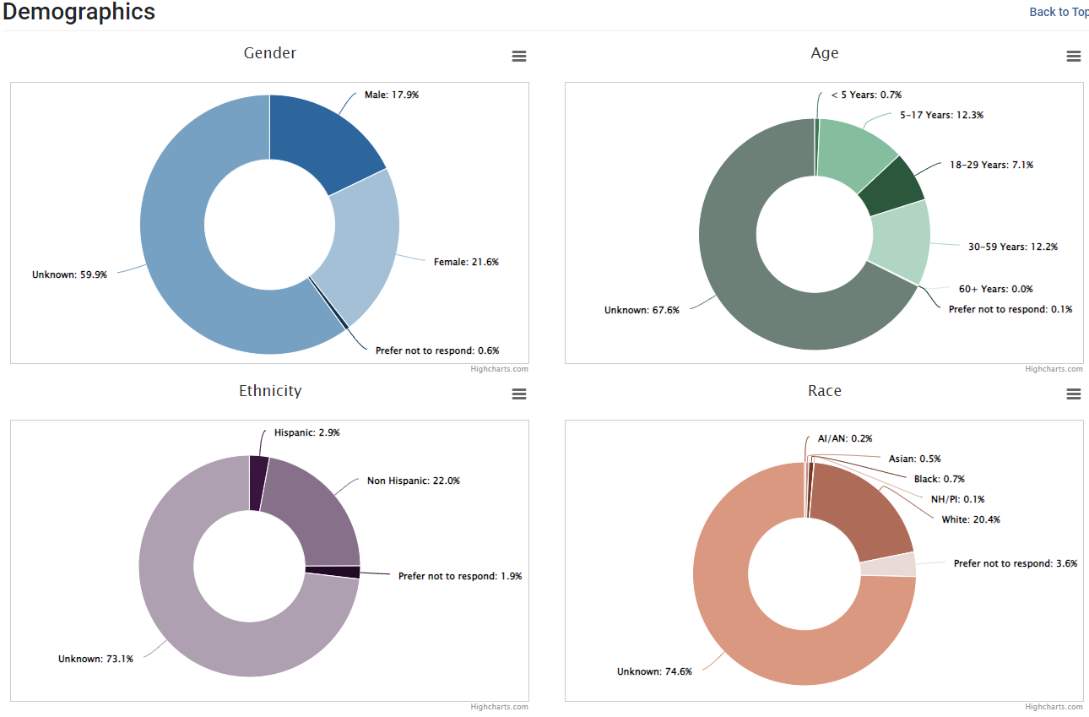
- Demographics
The Demographics chart depicts the demographics breakdown for Sex, Age, Ethnicity, and Race. Hover over each section of the pie chart to view a count of participants. Demographics are reported for activities that correspond to the selected filter criteria.
- Number of Program Activities
The Number of Program Activities chart depicts the number of Program Activities delivered per county. Hover over a county to view a count of Program Activities. Data is shown for activities that correspond to the selected filter criteria.
- Random Favorite Quotes
The Random Favorite Quotes section lists quotes from Success Stories that correspond to the selected filter criteria. Up to four quotes are randomly pulled from Success Stories logged in PEARS.
- Impact Data
The Impact Data chart compares the mean of pre and post survey questions with the most responses. Hover over each section of the bar graph to view a count of participants. Data is shown for activities that correspond to the selected filter criteria.
Some sections allow individual charts to be printed or saved.
- Click the chart menu.

- Select an option from the list to print the chart, save as a PDF, or save as an image.
